Analyzing user behavior with heatmaps
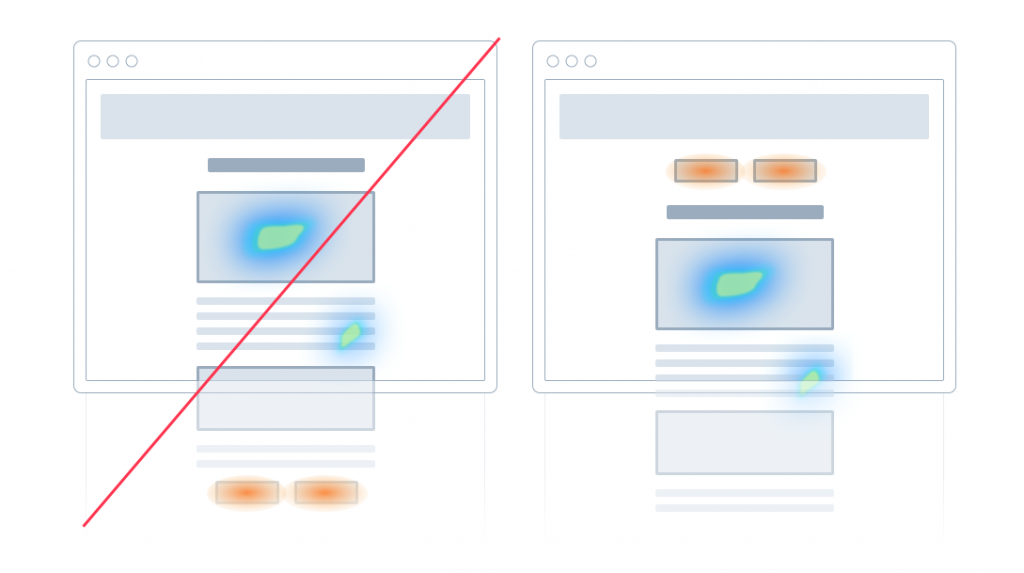
Heatmaps can provide insights into how users interact with specific pages. You can then use this info to help redesign your website or make adjustments to help retain visitors and improve your conversion rates. Heatmaps can show whether visitors are interacting with your important content, and if they see what you want them to see.
Be sure users are using your project correctly
It is best to make heatmaps from pages that have high traffic. Examples of these pages can be your homepage, landing pages, and pages with high bounce rates.
Smartlook offers three types of heatmap overlays: click, scroll, move, and scroll. You can use each to help you see how your users use your project.

Click, move, and scroll heatmaps
Click and move overlays
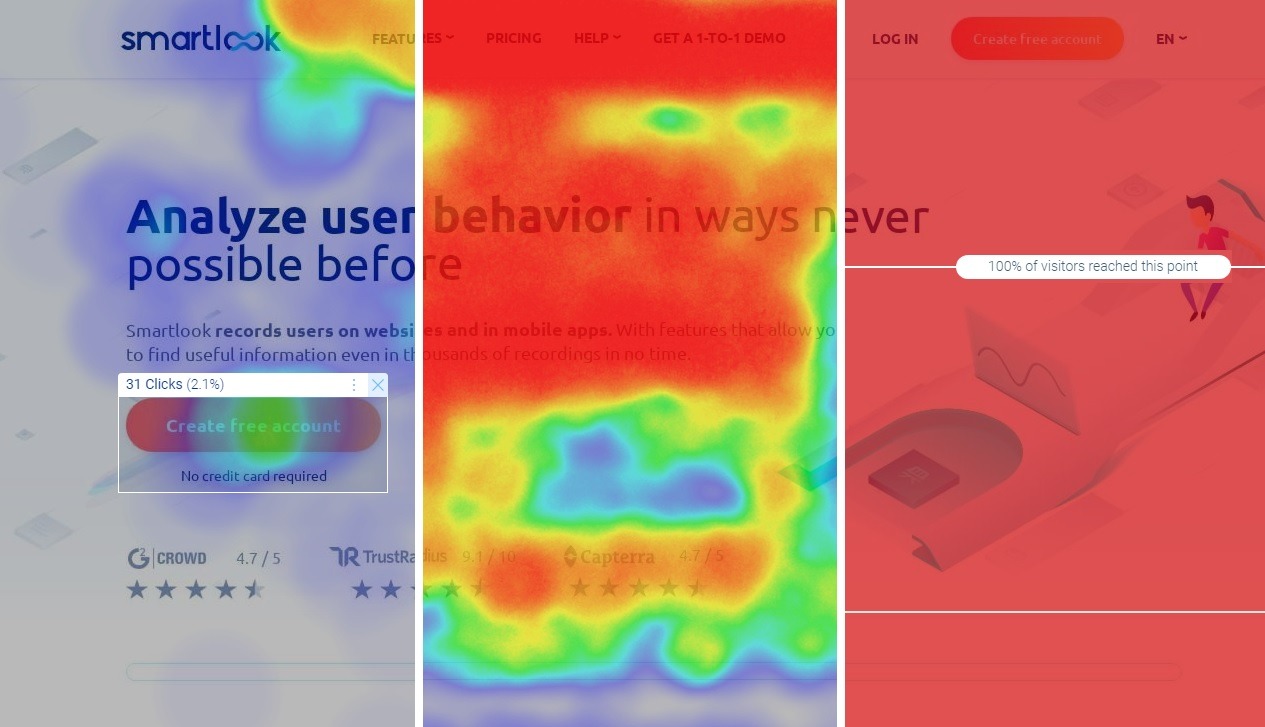
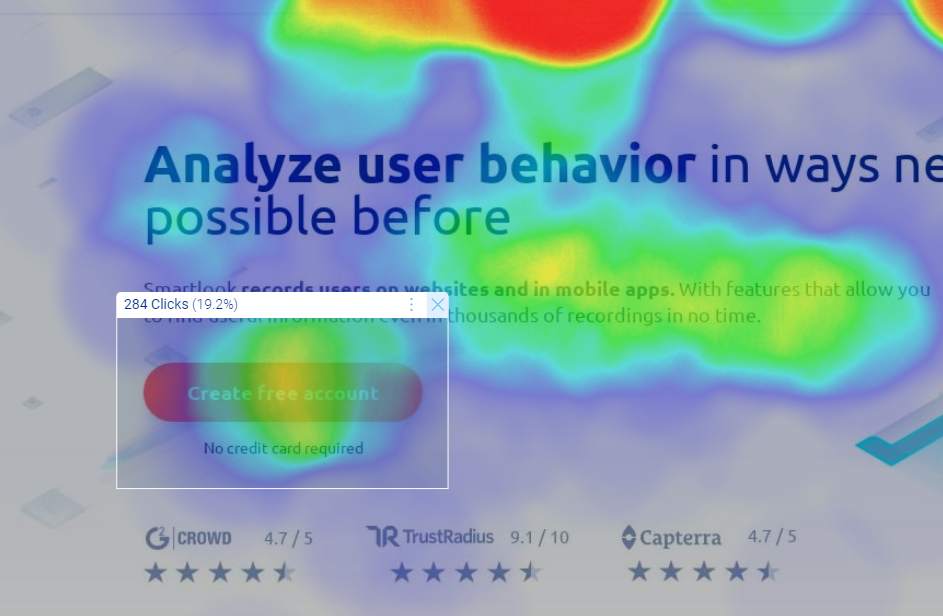
Click and move heatmap overlays help you see where your users click and move their cursors in your project. Using click heatmaps, you can see if users are clicking elements of your website that are not clickable, or if they are using CTAs (call-to-action) buttons. Move heatmaps show you if your users are looking in the right places of the website.
When analyzing click and move heatmaps, the click activity is represented by colors. The more concentrated the activity, the warmer the color. The color gradient is not proportional to the amount of activity. In click heatmaps, drag and drop to see the exact number of clicks on the selected area.

Scroll overlay
With scroll heatmaps, you can see how much of your project your users see if it is not contained on one screen. The fold line of your project is where the screen ends and users have to scroll to see the rest.

Using scroll heatmaps, you can see what percentage of users reach certain areas of your project. Then, you can then see if important elements of your project are below the fold line and take action.
For users of paid plans
If you are using one of Smartlook's paid plans, you can generate heatmaps using data from All visitors, Only new visitors, or Only returning visitors.
Updated 5 months ago
