Smartlook DevTools
Smartlook DevTools gives you and your team the technical data to see what’s happening in the browser of the visitors on your website. It gives you direct data from your users’ browser, allowing for a deeper analysis of the user experience to confirm:
- Network activity
- Console logs
- JavaScript errors
- Latency issues experienced by visitors
You can extend your data further into the headers and bodies of user browser requests and responses by setting up Advanced network recording.
How to enable DevTools
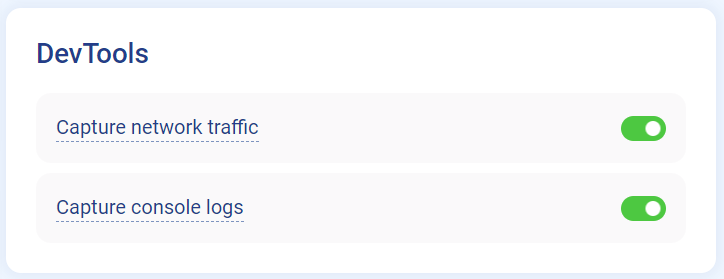
You can enable DevTools in the Projects settings by enabling:
- Capture console logs—Capture everything your app logs in the console to gain better insights on what's going on
- Capture network traffic—Inspect network communication that occured during the recording
When DevTools are enabled, you can view them in the Smartlook player.
DevTools components
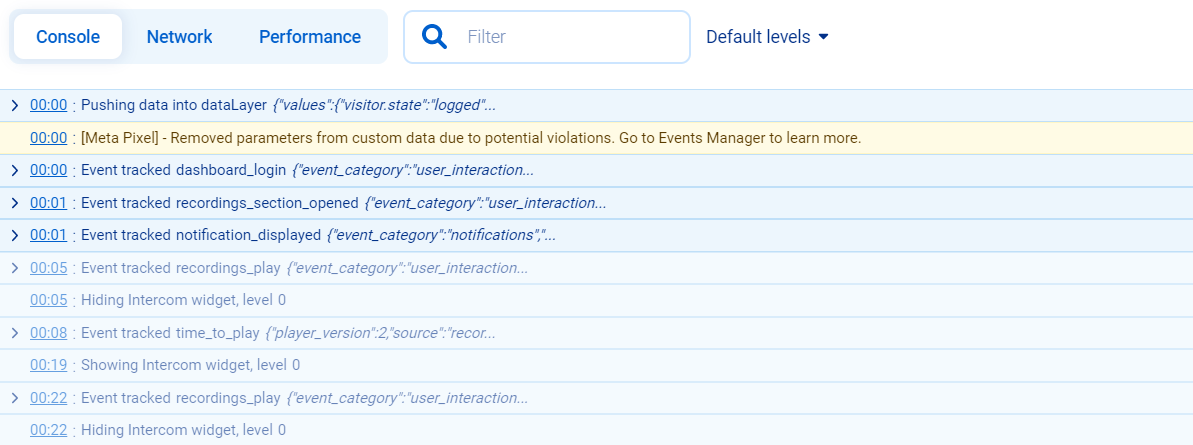
Console tab
The Console tab includes Logs, Errors, Warnings, Info, and Debug areas. You can use these to review all the most important notifications from the JS console.
Our users can already use an API method to send their own custom JavaScript errors and messages to Smartlook. For more information on how Smartlook handles default and custom JavaScript errors, see Error detection.
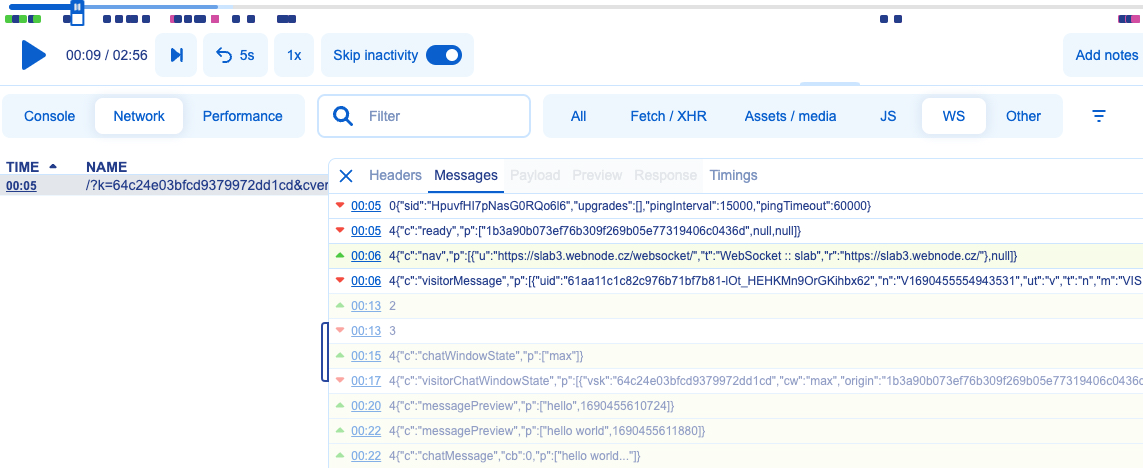
Network tab
The Network tab displays an overview of all assets downloaded by the user’s browser during their session. The data can be sub-divided into Fetch/XHR, Assest/media, JavaScript, WebSocket, or other assets. You can edit what data you see in the table by clicking the more icon.
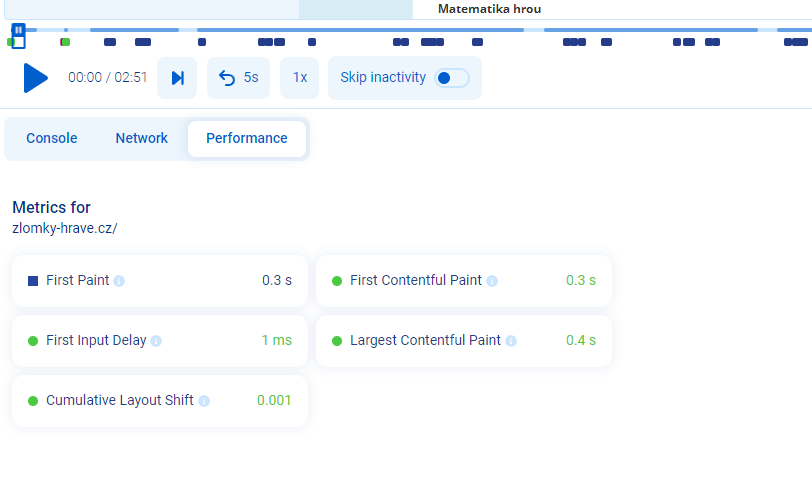
Performance tab
The performance tab displays web-related metrics for your user's browser during their session. Available metrics include:
| Metric | Description |
|---|---|
| First Paint | The time between navigation and when the browser first renders pixels to the screen. |
| First Contentful Paint | The time from when the page starts loading to when any part of the page's content is rendered on the screen. |
| First Input Delay | The time from when a user first interacts with a page to the time when the browser is actually able to begin processing event handlers in response to that interaction. |
| Largest Contentful Paint | The render time of the largest image or text block visible within the viewport, relative to when the page first started loading. |
| Cumulative Layout Shift | A measure of the largest burst of layout shift scores for every unexpected layout shift that occurs during the entire lifespan of a page. |
DevTools FAQ
Are DevTools only for developers?
Devtools can be used by any Smartlook user to quickly help identify a problem. For example, a visitor clicks a button and nothing happens. You can open DevTools to check for issues and notice an Uncaught TypeError: Cannot read property of undefined message. You can then share the session with members of your development team.
Why is browser information important for analyzing your website?
For every UX designer, developer, marketer, store owner, and product manager, there is a simple goal of making their website as logical, effective, and functional as possible. However, as devices, software, and location can vary for every user, it’s often difficult for web designers to put themselves into the shoes of every visitor.
DevTools give your developers the technical information they need to experience their website’s functionality using the customer's browser as a data source. Now you can view how the website works technically for all recorded browsers, devices, and (perhaps most importantly) from anywhere in the world. DevTools takes the guess work out of the equation. Just as Smartlook sessions provide analysts with the luxury of experiencing their website through their customers’ eyes, Smartlook DevTools provides analysts the possibility to experience the technical loading of the website through the eyes of the browser.
Updated 11 months ago