Funnels
What funnels are and how you can use them
What are funnels?
Funnels are a series of events your users take and the data associated with those steps. You can make funnels out of any series of events. Some of the data can include: how many visitors completed the step and how many dropped off. This is very common in quantitative analytics as funnels show you where in a process you lose most of your visitors, otherwise known as a bottleneck.
On top of that, funnels paired with recordings allow you to see exactly why your visitors have left whichever process you defined in the funnel.
Navigating the funnels page
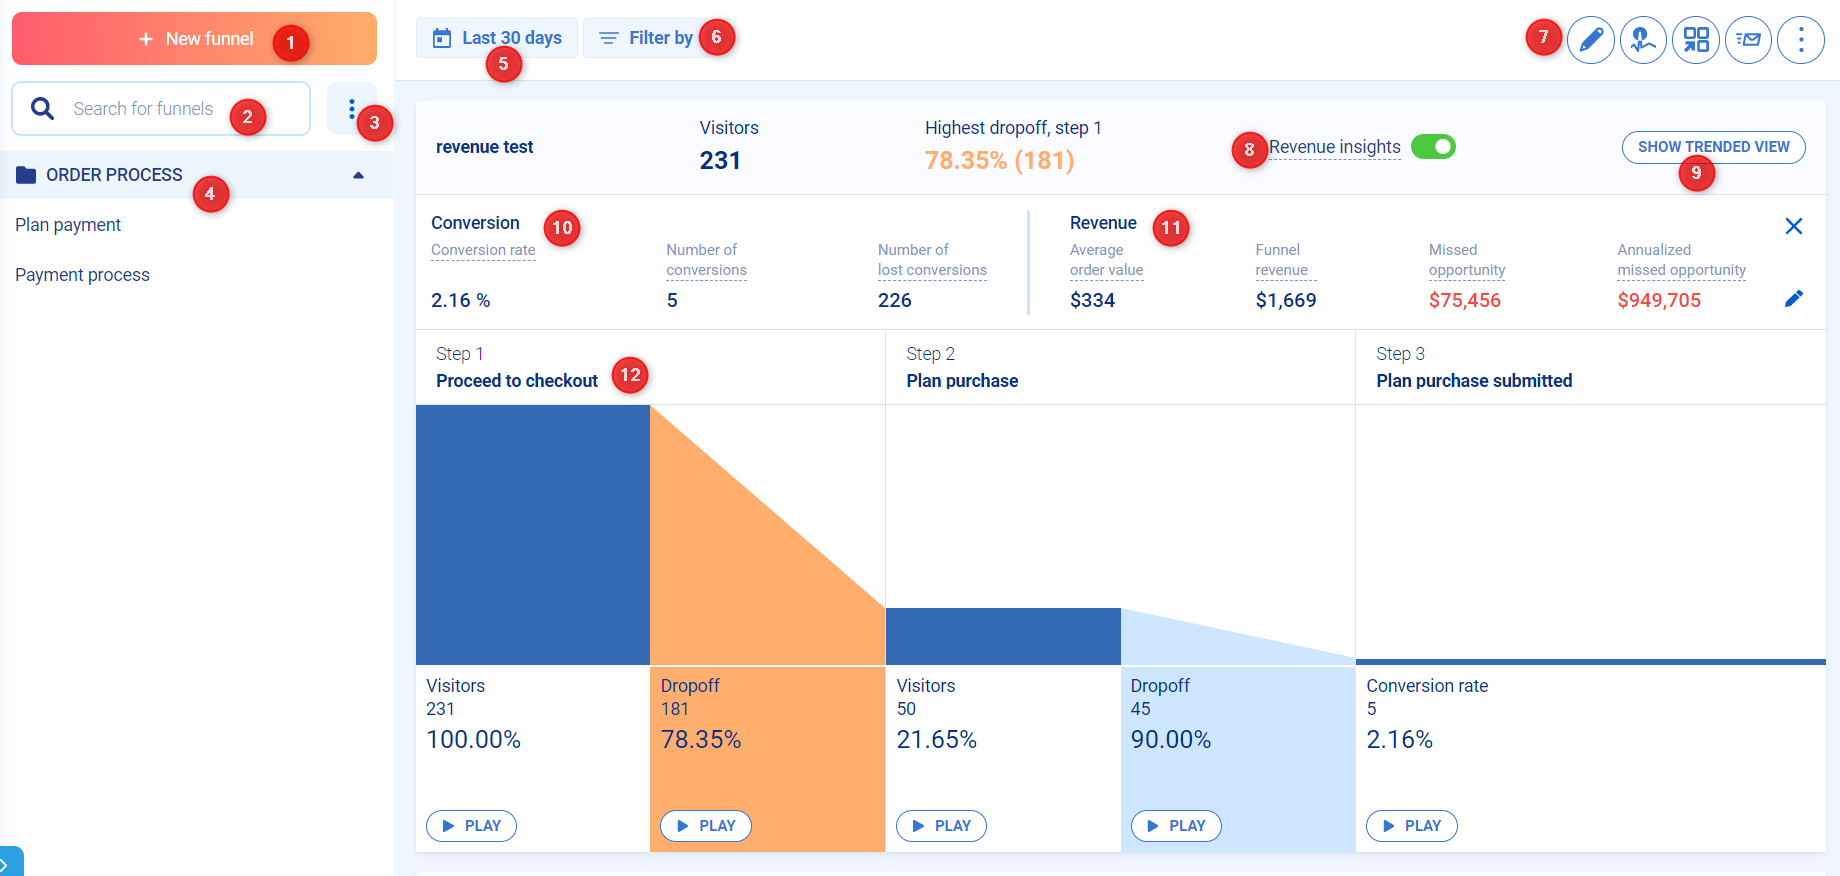
- New funnel—Add a new funnel
- Funnel search—Search for funnels in your project
- Manage categories—Manage and sort your funnel categories
- List of funnels—List of all funnels in your project
- Date range—Set the date range for funnel data
- Filter by—Add filters to funnel data
- Edit, Anomalies monitoring, Add tile to dashboard, Share, and other options
- Enable Revenue insights—Add revenue insights to your funnel
- Show trended view—View data as a trend
- Conversion data—Data related to conversions in your funnel
- Revenue data—Data related to revenue in your funnel. Only displayed when Revenue insights is enabled.
- Funnel steps—Steps of your funnel with the option to Play sessions
Understanding your funnels
The largest drop off in your funnel is represented by the orange step, allowing you to see where you are losing the most users in your funnel.
Updated 11 months ago
Did this page help you?